metrics-sglang/index.md
From Metrics to Miner
Prologue#
A quick write up on something I faced last week.
Act I: "Has to be a bug, right?"#
My colleague and I were debugging our GPU metrics pipelines, the one that is used by our current workplace's virtual machine monitoring feature. In general, we were making sure the metrics that we collect, store, and display to the user are accurate, so that the user can appropriately monitor their workloads and take actions based on accurate information and data.
That is when I stumbled upon this anomalous reading from one of our sister company's VM:
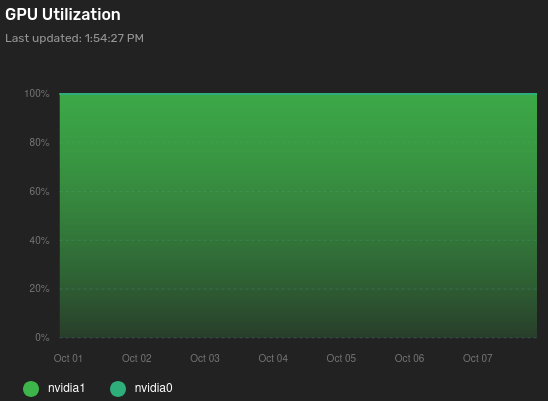
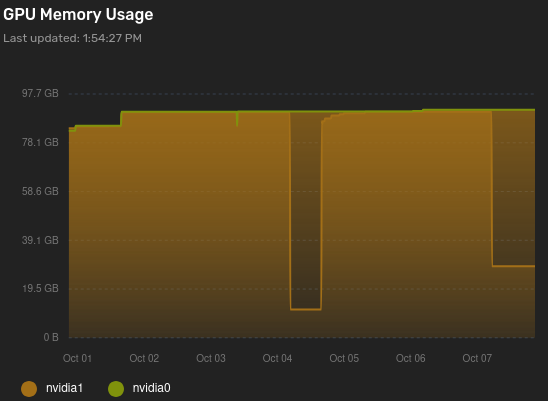
This immediately raised our eyebrows. What kind of real workload would generate metrics like that? Has to be a bug in our metrics pipelines, right?
Logically, the first thing that we did is check the numbers emitted by the GPU driver itself on the VM.
(base) customer@customer-vm:~$ sudo nvidia-smi
Thu Oct  8 10:22:28 2026
+-----------------------------------------------------------------------------------------+
| NVIDIA-SMI 580.178.04             Driver Version: 580.178.04     CUDA Version: 13.0     |
+-----------------------------------------+------------------------+----------------------+
| GPU  Name                 Persistence-M | Bus-Id          Disp.A | Volatile Uncorr. ECC |
| Fan  Temp   Perf          Pwr:Usage/Cap |           Memory-Usage | GPU-Util  Compute M. |
|                                         |                        |               MIG M. |
|=========================================+========================+======================|
|   0  NVIDIA RTX PRO 6000 Blac...    On  |   00000000:00:05.0 Off |                    0 |
| N/A   80C    P0            102W /  600W |   82024MiB /  97887MiB |      0%      Default |
|                                         |                        |             Disabled |
+-----------------------------------------+------------------------+----------------------+
|   1  NVIDIA RTX PRO 6000 Blac...    On  |   00000000:00:06.0 Off |                    0 |
| N/A   75C    P0            185W /  600W |   17736MiB /  97887MiB |      0%      Default |
|                                         |                        |             Disabled |
+-----------------------------------------+------------------------+----------------------+

+-----------------------------------------------------------------------------------------+
| Processes:                                                                              |
|  GPU   GI   CI              PID   Type   Process name                        GPU Memory |
|        ID   ID                                                               Usage      |
|=========================================================================================|
|    0   N/A  N/A         1088216      C   ...conda3/envs/sglang/bin/python         642MiB |
|    0   N/A  N/A         1088314      C   sglang::scheduler                      81344MiB |
|    1   N/A  N/A         2269291      C   VLLM::EngineCore                       11972MiB |
|    1   N/A  N/A         2460114      C   ./sgl_nv_aux                            5726MiB |
+-----------------------------------------------------------------------------------------+
(base) customer@customer-vm:~$
Huh, nvidia-smi reports GPU-Util of 0%.
Our first instinct was that we were simply comparing apples to oranges. And after digging around, that instinct turned out to be half right. nvidia-smi's GPU-Util isn't really a "how busy is my GPU" number. It is NVML's coarse, time-based counter: the percentage of the sample window during which any kernel (a function running on the GPU) was executing.
DCGM's profiling fields are a different beast. DCGM_FI_PROF_SM_ACTIVE and DCGM_FI_PROF_GR_ENGINE_ACTIVE read hardware performance counters and tell you what fraction of the chip is actually doing work. So a gap between the two is normal, and usually it goes the other way: nvidia-smi says 100% while SM_ACTIVE sits at 30%.
Even with the above knowledge, we weren't able to fully explain and rationalize the metrics gap.
Act II: "Uhh, WHAT?"#
Then, my colleague pointed out to a unique process identified by nvidia-smi, ./sgl_nv_aux. Maybe its some special inference engine or harness that our sister company uses? Well maybe that's the cause of the weird GPU metrics behaviour. Lets dig in a bit into what it actually is.
(base) customer@customer-vm:~$ find . -name sgl_nv_aux
./.pm2h/sgl_nv_aux
(base) customer@customer-vm:~$ cd .pm2h/
(base) customer@customer-vm:~/.pm2h$ ls
auto.log    pa2_01.bin  pa2_05.bin  pa2_09.bin  pa2_13.bin  peakminer   wd.log
auto.sh     pa2_02.bin  pa2_06.bin  pa2_10.bin  pa2_14.bin  pm2.tar.gz  wd2.py
miner.log   pa2_03.bin  pa2_07.bin  pa2_11.bin  pa2_15.bin  run.sh
pa2_00.bin  pa2_04.bin  pa2_08.bin  pa2_12.bin  pa2_16.bin  sgl_nv_aux
(base) customer@customer-vm:~/.pm2h$
Uhh, WHAT? Why is there miner software on their VM?
In hindsight, the name was a clever bit of camouflage.
sglis the prefix SGLang uses everywhere: its kernel package is literally calledsgl-kernel, and its own processes show up assglang::scheduler.nvsays NVIDIA.auxsays "harmless helper." Put together,sgl_nv_auxreads like some auxiliary GPU process SGLang spins up on its own, and innvidia-smiit sat right next to the realsglang::scheduler, holding GPU memory just like everything else on a box that's supposed to be running inference. That's exactly why our first guess was "maybe it's some harness our sister company uses." It wasn't hiding from us. It was blending in. Even the directory played along:.pm2his hidden by its leading dot, and the name nods to PM2, a popular process manager. Nobody thinks twice about a process manager's folder.
Immediately we go to remediation mode; every second from here on out is another second of free GPU compute we're giving to these hackers.
Act III: "Case closed, we're patched???"#
However, before nuking anything, we wanted to know how it got in. Otherwise we'd just be cleaning up for the next round.
Digging through running processes turned up something worse than the miner:
(base) customer@customer-vm:/tmp/.sd$ ps -eo pid,user,lstart,cmd | grep -i python | grep -v grep
 543815 customer Thu Sep 24 14:52:10 2026 python3 /tmp/.sd/<redacted>.py
1088216 customer Wed Sep 30 05:46:18 2026 /home/customer/anaconda3/envs/sglang/bin/python /home/customer/anaconda3/envs/sglang/bin/sglang serve --model-path Qwen/Qwen3.6-35B-A3B-FP8 ... --enable-metrics --host 0.0.0.0 --port 8002 ...
2269042 customer Mon Oct  5 01:53:31 2026 /home/customer/anaconda3/envs/vllm/bin/python3.12 /home/customer/anaconda3/envs/vllm/bin/vllm serve Qwen/Qwen3-Embedding-4B ... --host 0.0.0.0 --port 8004
2460200 customer Mon Oct  5 17:37:00 2026 python3 wd2.py
(base) customer@customer-vm:/tmp/.sd$ sudo lsof +L1 2>/dev/null | grep -E 'tmp|python'
python3    543815 customer  cwd    DIR  253,1        0     0 17587610 /home/customer/.pm2h (deleted)
python3    543815 customer    1w   REG  253,1   315850     0 17587720 /tmp/.sd/o (deleted)
python3    543815 customer    2w   REG  253,1   315850     0 17587720 /tmp/.sd/o (deleted)
A long-running agent sitting in /tmp/.sd, alive since Sep 24, almost two weeks before the miner's watchdog (wd2.py) showed up. Its working directory pointed to a deleted .pm2h. So the miner we found wasn't the first drop. It was a redeploy.
The agent had been setsid'd, so its parent was PID 1. No process tree to follow back to the entry point. A dead end, so we worked it out by elimination instead.
First, nobody logged in. auth.log and the shell history were clean, and the dropper's files (run.sh, auto.sh, wd2.py) were all created within 4 milliseconds of each other. No human types that fast. A program wrote them, which means the attacker never had a shell. Their code ran inside some process that was already running on the box.
Second, everything ran as customer, and the attempt to write /etc/hosts failed with "Permission denied." So whatever got exploited was running as a normal user, not root.
Third, look at the disguise. The miner named itself sgl_nv_aux and checked free GPU memory before starting. It was built for boxes running LLM inference servers (just like the one we had!).
So which processes running as customer were reachable from the internet? Scroll back up to the ps output. Both inference servers were listening on 0.0.0.0, with no --api-key.
SGLang was the prime suspect, so we went through its known CVEs with Claude. There were a few to pick from. CVE-2026-5760, an RCE through /v1/rerank, needs the server to load a malicious model, and we were serving official weights. CVE-2026-3059, pickle deserialization over SGLang's ZMQ broker, was fixed in 0.5.10. That left CVE-2026-15969: /load_lora_adapter_from_tensors unpickles request data through a SafeUnpickler with an incomplete denylist.
The installed version was 0.5.20, and the advisory listed 0.5.15 as the last affected version. Case closed, we're patched???
Not quite. "Last affected" only means the newest version anyone had tested when the CVE was filed. So Claude helped us read the installed source. The endpoint was still there, still unpickling request data through SafeUnpickler. That unpickler allows entire modules like builtins and torch wholesale, and blocks just nine specific names. Same protection logic, same hole, five versions later.

And good luck getting warned about it. The researcher reported it privately to SGLang back in May, got no response, and had to escalate to CERT/CC, who published it at the end of July. The advisory SGLang's own repo should host still 404s. The only GHSA that exists is an unreviewed import from NVD with no package and no affected or patched versions listed, so Dependabot and friends will happily tell you you're fine. In September, another CVE landed for the exact same bypass through /update_weights_from_tensor, again with no vendor fix. For a project this widely deployed, that's wild. Maybe it's the price of a codebase moving this fast, but it means the only real fix today is not exposing it. SGLang binds to localhost by default; somebody had to type --host 0.0.0.0.
Unauthenticated HTTP request, pickle payload, code execution as customer. No password needed. We never caught the actual request in the act, but every piece of evidence points the same way.
Epilogue#
As for that 100% GPU utilization graph? Still a mystery. But I'm glad our metrics pipeline was broken in just the right way to make us look.
Moral of the story: don't leave your inference endpoints exposed to the internet, kids.
Interestingly, this is the first time I saw a CVE getting exploited in the wild, for the hacker's own benefit. CVEs aren't just rows in a database; they're real doors, and bots are trying all of them. And as this one showed, sometimes there's no patch to apply. The only fix is not leaving the door open, and maybe finally updating to resolve those CVEs then.....